The Most Predictable Football Leagues in the World — What 44,479 Matches Reveal
By Dimitar Goshevski · Published: June 11, 2026
Some football leagues can be read like a book. Others have spent three years making our machine-learning model look silly. After 44,479 finished matches across 76 competitions, every prediction recorded before kickoff and settled against the final result, we sat down to answer a question we get asked a lot: which leagues does the model actually predict well?

How we measured it
For every match, the model assigns probabilities to each outcome before kickoff. We take its highest-probability pick and check it against the final score. Simple. The less simple part is judging what a "good" hit rate means, so we use three yardsticks:
Rankings cover 44 domestic leagues with at least 300 analysed matches. Cups are excluded; knockout football is a different sport statistically, and it gets its own section below.
The most predictable leagues for match winners
| # | League | Country | Model hit rate (1X2) |
|---|---|---|---|
| 1 | Premier League | Ukraine | 60% |
| 2 | Eliteserien | Norway | 58% |
| 3 | La Liga 2 | Spain | 58% |
| 4 | Premiership | Scotland | 56% |
| 5 | Süper Lig | Turkey | 55% |
| 6 | Premier League | Russia | 55% |
| 7 | 1. HNL | Croatia | 55% |
| 8 | Serie B | Italy | 54% |
| 9 | Pro League | Saudi Arabia | 54% |
| 10 | League Two | England | 53% |
The least predictable leagues for match winners
| # | League | Country | Model hit rate (1X2) |
|---|---|---|---|
| 1 | Persian Gulf Pro League | Iran | 33% |
| 2 | A-League Men | Australia | 33% |
| 3 | K League 1 | South Korea | 39% |
| 4 | Ligue 2 | France | 39% |
| 5 | Super League | Greece | 39% |
| 6 | Super League | China | 39% |
| 7 | Championship | England | 40% |
| 8 | Allsvenskan | Sweden | 42% |
| 9 | Liga Profesional | Argentina | 43% |
| 10 | Botola Pro | Morocco | 43% |
Anyone who has watched the Championship on a wet Tuesday night already suspected this, but now there's a number on it: across 1,634 analysed matches, the model's full-time pick lands just 40% of the time. England's own fourth tier, League Two, manages 53%. Hold that thought, though. The Championship gets its revenge later in this article.

The Iran paradox
Iran's Persian Gulf Pro League finished rock bottom for match winners. It is also, at the same time, the most predictable league in our entire dataset for everything else:
| Market | Iran's hit rate | Iran's rank (of 44 leagues) |
|---|---|---|
| Full-Time Result | 33% | last |
| Over/Under 2.5 Goals | 74% | 1st |
| Over/Under 3.5 Goals | 88% | 1st |
| BTTS (Both Teams to Score) | 69% | 1st |
| First Half Result | 66% | 1st |
The league's character explains it. Iranian matches produce the fewest goals in our data (1.94 per game) and the most draws (34.8%). Low scoring turns the winner market into a three-way lottery, and at the very same time makes goals markets close to mechanical. The chaos that ruins one prediction quietly feeds another.
And it's not just Iran. Look at the leagues our model struggles with for match winners, and check what happens one column over:
| League | Model hit rate (1X2) | O/U 3.5 hit | BTTS hit |
|---|---|---|---|
| Persian Gulf Pro League (Iran) | 33% | 88% | 69% |
| Botola Pro (Morocco) | 43% | 85% | 60% |
| Premier League (Egypt) | 44% | 84% | 63% |
| K League 1 (South Korea) | 39% | 82% | 61% |
| Liga Profesional (Argentina) | 43% | 82% | 62% |
If you only ever ask "who wins?", these leagues look like noise. Ask "how many goals?" and they're suddenly the most legible competitions in world football.

Hit rate is not skill
Time for the uncomfortable part, including for us. A high hit rate can mean a smart model or an easy market, and the difference matters. Iran's 88% on Over/Under 3.5 looks spectacular, but in a league averaging 1.94 goals, "under" is nearly always the right answer anyway. A parrot trained to say "under" would have a decent season there.
So we built a "naive baseline" for every league. Here's the idea, with Ukraine as the example. Over our full dataset, the most common outcome in Ukrainian matches is a home win, at 38.6% of games. Imagine a bettor with zero football knowledge who simply predicts "home win" for every single match, forever. They'd be right 38.6% of the time. That score — what blind repetition alone achieves — is the naive baseline. Any model worth running has to beat it, because matching it requires no intelligence at all.
We subtracted each league's naive baseline from the model's hit rate. What's left over is skill. And the rankings transform.
Ukraine's 60% turns out to be the real thing. Against that 38.6% baseline, the model sits 21.4 percentage points higher — the largest skill gap in the dataset, roughly double the runner-up (La Liga 2, +12.8pp). We'll be honest: we re-checked this one a few times expecting to find a data problem. We didn't. The model isn't just riding favourites in Ukraine; it's reading the league.
Iran's goals numbers, on the other hand, are mostly gravity. Behind that 88% sits about +4pp of real skill on Over/Under 2.5 and +8pp on BTTS. Still positive, still useful, but most of the famous 88% is the market being easy. We'd rather tell you that than let a big number do the talking.
And the Championship? Football's chaos league for match winners is the single most skill-rich league in our dataset for goals markets: +15.4pp over baseline on BTTS and +8.9pp on Over/Under 2.5, both first among all 44 leagues. Its matches are unpredictable in outcome but full of readable scoring patterns, which is precisely where a model earns its keep. Sweden's Allsvenskan (+13.0pp on BTTS) and Scotland's Premiership (+11.1pp) show the same shape.
Across all leagues, the median skill on match winners is +4.4pp, while goals markets hover closer to their baselines. Which begs a question: if the model's skill-over-naive is biggest in 1X2, why do we keep saying goals markets are our strength?
The yardstick that pays: beating the bookmaker
| Market | Model success rate | Bookmaker-implied | Edge |
|---|---|---|---|
| First Half Result | 45.2% | 40.0% | +13.1% |
| Over/Under 3.5 Goals | 70.2% | 62.3% | +12.8% |
| Over/Under 2.5 Goals | 56.8% | 54.1% | +4.9% |
| BTTS (Both Teams to Score) | 55.2% | 54.4% | +1.5% |
| Full-Time Result | 50.4% | 50.2% | +0.4% |
Notice the inversion. Against the naive baseline, 1X2 was our best market; against the bookmaker, it's our thinnest. The market where the most betting money concentrates is also the one priced most sharply. Our edge lives in goals and first-half markets, where pricing is loosest. Three yardsticks, three different winners — and all three are true at once.
So what makes a league predictable? We tested three theories
Which leaves Ukraine, the most predictable league of all, politely refusing every explanation we threw at it: below-average home advantage (38.6%), a normal draw rate (28%), the ninth-biggest duopoly share (16.8%). Some leagues are simply legible to a model in ways no single statistic captures. We're as curious about it as you are.
The big five: England is the outlier, twice
Among the big five, the Premier League (47%) and Ligue 1 (47%) are meaningfully harder to call than La Liga, Serie A and the Bundesliga (all 52%). Premier League matches end level 24.6% of the time, and its mid-table would beat anyone on its day, which is wonderful for neutrals and miserable for prediction models.
The Bundesliga sits at the opposite pole: 3.19 goals per game (highest of the five) and BTTS landing in 60.4% of matches make Germany the big-five league where goals predictions thrive. And a quiet word for Serie A, which outperforms its defensive reputation where it counts: +11.6pp of model skill over baseline on match winners, best of the five.

Knockout cups are a different sport
We excluded cups from the ranking, and the data shows why that was the right call. The Champions League produces a draw just 18.1% of the time, against 25.2% across all matches, and averages 3.14 goals per game. The Dutch KNVB Beker is the most extreme competition we track: 3.85 goals per match and draws in only 6.3% of fixtures (partly a knockout artifact — ties that finish level go to extra time, and our data records the final outcome). Less drawing, more scoring, bigger gaps between strong and weak. Cup football flatters goals markets and punishes exact-score guesswork.
The clubs the model reads best
Team-level tracking has been running since February 2026, which lets us name names. Minimum 25 predicted matches, and treat these as current-form readings rather than eternal truths:
| Club | League | Model hit rate (1X2) | Matches |
|---|---|---|---|
| Enosis | 1. Division (Cyprus) | 87.9% | 33 |
| Al Nassr | Pro League (Saudi Arabia) | 84.8% | 33 |
| Bayern München | Bundesliga (Germany) | 82.4% | 34 |
| FC Barcelona | La Liga (Spain) | 81.6% | 38 |
| Haugesund | Eliteserien (Norway) | 80.0% | 30 |
| PSV | Eredivisie (Netherlands) | 79.4% | 34 |
| Porto | Liga Portugal (Portugal) | 76.5% | 34 |
| Real Madrid | La Liga (Spain) | 76.3% | 38 |
| Arsenal | Premier League (England) | 73.7% | 38 |
Yes, the most predictable club on the planet right now plays in Cyprus. We had to look Enosis up too. The pattern underneath is familiar though: dominant clubs are predictable clubs. When Bayern or Barcelona play, the most probable outcome usually has the good manners to happen. At the other end live the model's tormentors: Belgium's La Louvière (22.2%) and Argentina's Tigre (24.0% over 50 matches) have spent the season specialising in whatever the model didn't pick.
Market specialists: the most predictable club in every market
| Market | Most predictable club | Hit rate | League |
|---|---|---|---|
| Over/Under 3.5 Goals | Talleres Córdoba | 98.0% | Liga Profesional (Argentina) |
| Double Chance | Enosis | 97.0% | 1. Division (Cyprus) |
| Over/Under 2.5 Goals | Bayern München | 94.1% | Bundesliga (Germany) |
| BTTS (Both Teams to Score) | NEC | 82.4% | Eredivisie (Netherlands) |
| First Half Result | Avispa Fukuoka | 73.7% | J1 League (Japan) |
| Correct Score | Lokomotiva Zagreb | 30.6% | 1. HNL (Croatia) |
Two details worth a second look. Talleres Córdoba play in one of the world's least predictable leagues for match winners, yet their goals pattern is the most reliable thing in our whole dataset: our Over/Under 3.5 pick landed in 49 of their 50 matches. And among Europe's heavyweights, Inter (94.7%) and Galatasaray (94.1%) are near-locks on the double chance market. A chaotic league and a predictable club can happily coexist. Markets have personalities, not just teams.

Which markets are easiest overall
Median model hit rates across the 44 ranked leagues:
| Market | Median | Best league |
|---|---|---|
| Over/Under 2.5 Goals | 56.9% | Iran, 74% |
| BTTS (Both Teams to Score) | 54.5% | Iran 69%, Championship 68% |
| Full-Time Result | 48.5% | Ukraine, 60% |
| First Half Result | 44.0% | Iran, 66% |
| Half-Time / Full-Time | 29.5% | 43% |
| Correct Score | 14.5% | 24% |
Two-outcome markets beat three-outcome markets, and anything that needs two answers at once (HT/FT) or an exact number (correct score) falls off a cliff. Correct score peaking at 24% in the single best league is worth remembering next time someone on social media advertises guaranteed correct scores. They are guaranteeing you a coin that lands on its edge.
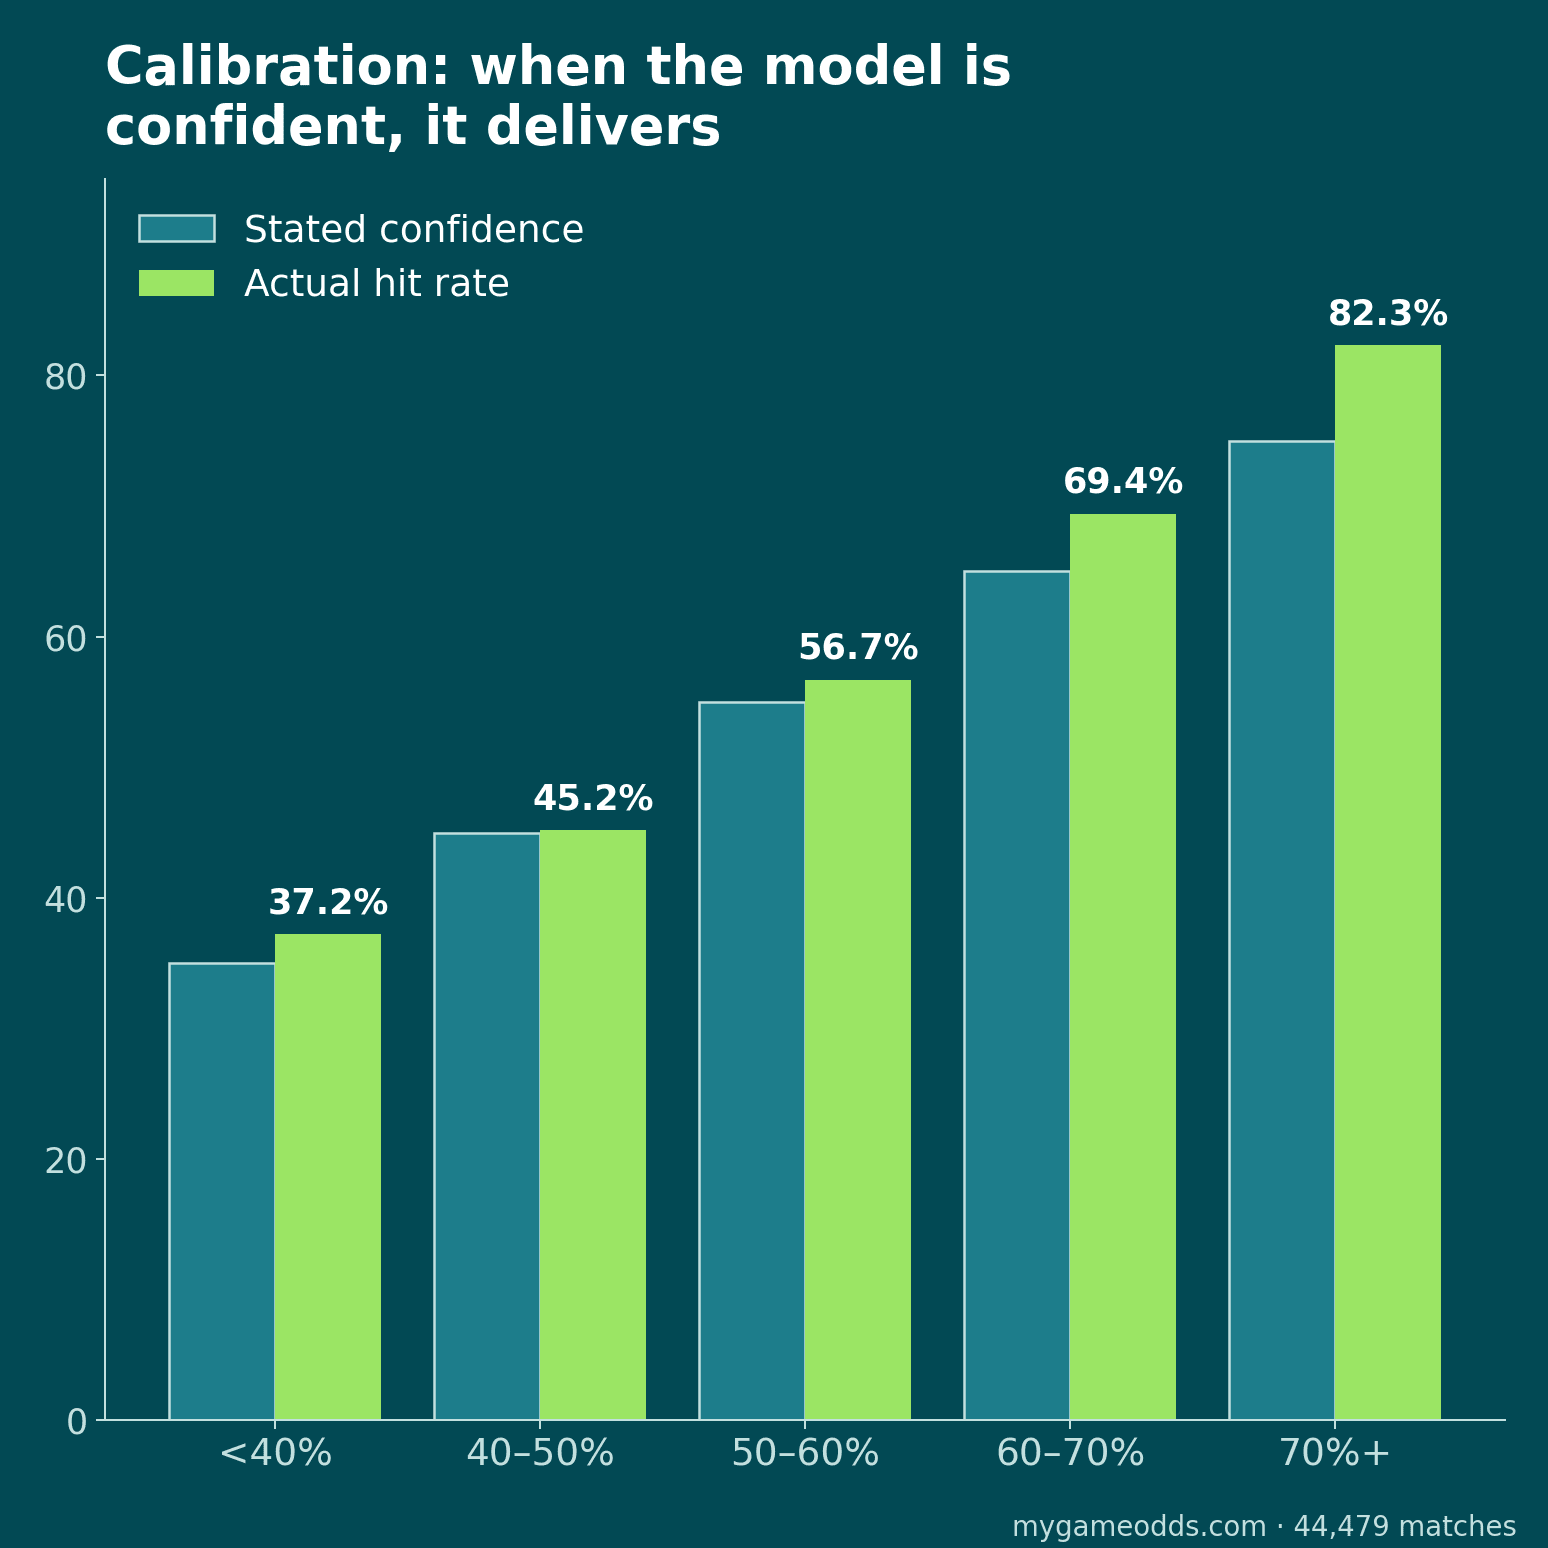
When the model is confident, it delivers
One more table, and arguably the most important one on this page. Across all 44,479 matches, the model's stated confidence tracks reality closely, and actually runs a little shy at the top:
| Model confidence | Matches | Actually landed |
|---|---|---|
| 70%+ | 1,943 | 82.3% |
| 60–70% | 4,654 | 69.4% |
| 50–60% | 10,629 | 56.7% |
| 40–50% | 19,295 | 45.2% |
| <40% | 7,879 | 37.2% |
What this means if you bet
The takeaway is not "bet on Ukraine." It's match the market to the league: