

Which leagues have the most goals?
Most goals
Free AI football predictions for today's matches in 81 leagues, from machine-learning models and checked against real results. Next to them, the stats we calculate ourselves with our own xG model, built from each match's shot data: attack vs defence, luck check and how each league compares.
No other football tips site runs like this: our engine rates every game, and a pick only goes out when it clears that market’s public bar. Every pick needs a real bookmaker price of at least 1.25 and has to pass the price checks for its market, including dropping prices that look too good to be true. The odds are locked the moment we publish. And every pick settles as won, lost or void on the public record — nothing hidden, nothing deleted.
Browse today’s free football tips, back the bet of the day, grab one of today’s ready-made accumulators or read how our AI football predictions work.
The same engine turns its strongest free daily tips into up to three ready-made accumulators every morning: a Banker Double, a Value Treble and The Longshot. Every leg must be fairly priced, at most 3% below our fair odd (team-total legs excepted), the combined odd is locked the moment the ticket goes out, and every ticket — won or lost — lands on the public record below.
See today's football accumulators or check the full accumulator record with running bankroll.
We check every match in the next 24 hours against both teams' last 10 league games for three trends: over 2.5 goals, both teams scoring and 10+ corners (for corners, only games with corner data count). A match shows here when both teams hit the same trend in at least 7 of those 10, so the pattern comes from both sides, not just one. A trend shows what has been happening, not what will happen.
Both teams saw 3+ goals in 7+ of their last 10 league games.
ProNo match qualifies today.
Top 3 over the last 12 months, competitions with 100+ matches
Most goals
Most often
 Tavernes0
 Valencia6
Winner
2 79%
BTTS*
No 65%
Correct Score
0-2 17%
Over/Under 2.5 goals
under 53%
Over/Under 3.5 goals
under 64%
Tavernes0Valencia6Winner
2 79%
BTTS*
No 65%
Correct Score
0-2 17%
Over/Under 2.5 goals
under 53%
Over/Under 3.5 goals
under 64%
Full Time
Team Goals Over/Under
| <0.5 | >0.5 | <1.5 | >1.5 | |
|---|---|---|---|---|
 | 71% | 29% | 96% | 4% |
 | 12% | 88% | 37% | 63% |
Goals Over/Under
| <2.5 | >2.5 | <3.5 | >3.5 | |
|---|---|---|---|---|
| FT | 53% | 47% | 64% | 36% |
Correct Score
0-2
17.1%
0-1
16.6%
0-3
11.9%
1-2
8.3%
0-0
7.2%
1-1
7.2%
*Probability of each predicted outcome is expressed in percentage (%)
*BTTS - Both teams to score
Smash-and-grab wins (the side with clearly fewer chances won) and upsets (results the closing odds gave under 20%) from the last 7 days.
How to read it
Nov 3–Nov 10 · 500 matches in our leagues · odds: closing, margin removed Korona Kielce0-2
 Radomiak Radom
Won with fewer chances: xG 1.0 vs 3.3
 Seattle Sounders2-1
 Los Angeles FC
Won with fewer chances: xG 0.5 vs 2.4
 Chicago Fire3-4
 Columbus Crew
Won with fewer chances: xG 1.3 vs 3.1
 Partizan1-2
 Mačva Šabac
 won at 6.2% in the closing odds
 Persepolis1-2
 Fajr Sepasi
 won at 7.3% in the closing odds
 Lincoln Red Imps1-0
 Hajduk Split
Lincoln Red Imps won at 8.2% in the closing odds
Calculated by MyGameOdds · xG: our own model
Smash-and-grab: the winner had at least 0.8 less xG than the loser (our xG, from shots). Upset: the result the closing odds gave under 20%, with the bookmaker margin removed. Across our leagues about 6% of matches are smash-and-grab wins and about 5% are upsets.
How we measure →All our leagues · Nov 3 – 9, 2026 · 528 matches
How often each result happened in this week’s matches across our leagues, next to how often the bookmakers’ closing odds said it would. This compares the betting market with what really happened — it is not our prediction accuracy. Our picks’ own record is shown in the results bars above.
How to read it
528 matches
46.2%
normal range ±3.9 pts
528 matches
22.2%
normal range ±3.6 pts
528 matches
31.6%
normal range ±3.7 pts
528 matches
54.0%
normal range ±4.1 pts
528 matches
53.8%
normal range ±4.2 pts
528 matches
32.2%
normal range ±4.0 pts
Home side ahead at half-time →
528 matches
33.3%
normal range ±3.9 pts
528 matches
41.7%
normal range ±4.1 pts
Away side ahead at half-time →
528 matches
25.0%
normal range ±3.6 pts
528 matches
46.8%
normal range ±4.0 pts
528 matches
37.3%
normal range ±3.9 pts
Shows what happened, not what comes next. Closing odds from one bookmaker per match, bookmaker margin removed. Updated daily.
| Result | Period | Matches | Happened | Odds expected | Gap (pts) | Normal range (± pts) | Verdict |
|---|---|---|---|---|---|---|---|
| Home wins | This week | 528 | 46.2% | 43.9% | +2.3 | ±3.9 | Normal range |
| Draws | This week | 528 | 22.2% | 23.7% | −1.6 | ±3.6 | Normal range |
| Away wins | This week | 528 | 31.6% | 32.3% | −0.7 | ±3.7 | Normal range |
| Over 2.5 goals | This week | 528 | 54.0% | 56.9% | −2.9 | ±4.1 | Normal range |
| Both teams scored | This week | 528 | 53.8% | 55.7% | −1.9 | ±4.2 | Normal range |
| Over 3.5 goals | This week | 528 | 32.2% | 35.6% | −3.4 | ±4.0 | Normal range |
| Home side ahead at half-time | This week | 528 | 33.3% | 34.6% | −1.3 | ±3.9 | Normal range |
| Level at half-time | This week | 528 | 41.7% | 38.9% | +2.8 | ±4.1 | Normal range |
| Away side ahead at half-time | This week | 528 | 25.0% | 26.5% | −1.5 | ±3.6 | Normal range |
| Home team scored 2+ | This week | 528 | 46.8% | 47.5% | −0.7 | ±4.0 | Normal range |
| Away team scored 2+ | This week | 528 | 37.3% | 38.1% | −0.8 | ±3.9 | Normal range |
Unlike generic betting tip pages, MyGameOdds tracks prediction accuracy across leagues and markets so users can evaluate performance over time. Explore our prediction results, league accuracy tracker and prediction performance hub to see how our model performs.
MyGameOdds.com is a football predictions and stats platform: 139,000+ fixtures analysed and over 4.1 million market-level predictions across 81 leagues. The 1X2, Both Teams to Score, Over/Under and Correct Score predictions come from machine-learning models; the stats around them we calculate ourselves from every match's shots, goals and odds: our own xG model (built on three seasons of shot data), attack vs defence, the luck check, league profiles and last week's smash-and-grab wins and upsets.
What sets us apart is verification. Most tipster sites ask you to take their word; we measure how accurately our predictions perform — by league and by market — and publish the results, including the misses. That transparency lets you judge our edge against real outcomes instead of marketing claims.
Our model analyses matches from more than 70 football leagues, including competitions such as the Premier League, Bundesliga, La Liga, Serie A, Ligue 1, UEFA Champions League, Europa League and many other major and emerging leagues worldwide. You can explore the full list in our Football Predictions Hub. Compare them all side by side in our league stats.
Next to the predictions, we calculate our own football stats from every match's shots, goals and odds: our own xG model (built on three seasons of shot data), attack vs defence charts, the luck check (a team's points against what its chances usually bring over its last 10 league games), league profiles, and last week's smash-and-grab wins and upsets. On the home page, Today at a glance shows the matches that stand out in the next 24 hours.
We track football prediction accuracy live using rolling performance windows. Success rates are calculated by league and betting market based on the last 100 matches. Accuracy is updated continuously for markets including 1X2, Both Teams to Score (BTTS), Over/Under 2.5 goals and Correct Score. You can explore full breakdowns in our League Accuracy Tracker. While no football prediction is guaranteed, transparent performance tracking helps refine and improve our AI models.
No model predicts football with 100% accuracy, and any site advertising 90%+ on match results is overselling. For 1X2 (home, draw or away) there are three possible outcomes, so random guessing averages about 33% — realistic data-driven models score meaningfully higher, but nowhere near 90%. Rather than ask you to trust a headline number, we publish our live success rate for every market and league: see our prediction results and league accuracy tracker and judge the model for yourself.
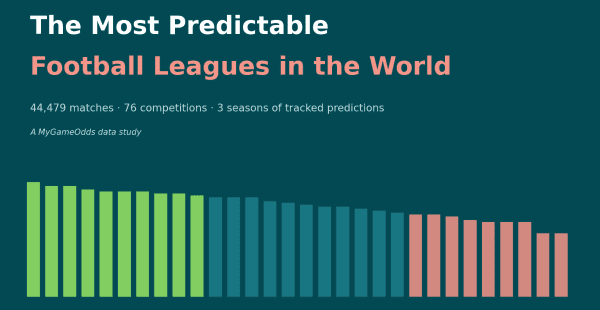
Ukraine tops the ranking, the Championship takes revenge in goals markets, and the least predictable league is secretly the most predictable. 44,479 matches analysed.
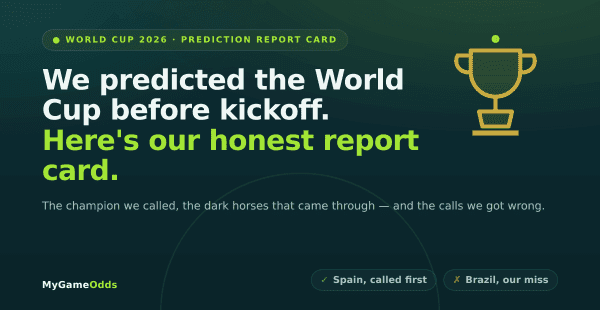
Spain called before kickoff, Mbappé's Golden Boot flagged, Brazil badly missed. Every 2026 World Cup prediction graded against real results and bookmaker odds.
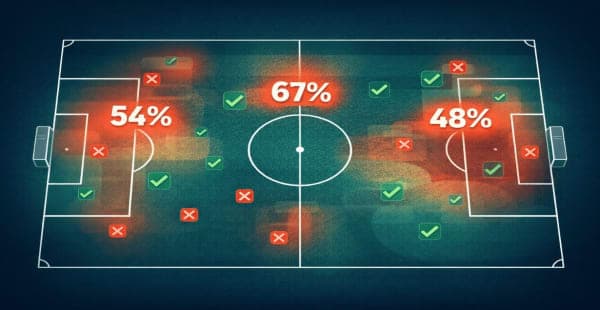
Most prediction sites claim 90%+ accuracy with zero proof. We break down what realistic accuracy looks like and show our verified numbers by league and market.
Recommended Partners


