

How Our AI Football Predictions Work
By Dimitar Goshevski · Last updated: October 8, 2026
MyGameOdds runs on a two-layer system: machine-learning models that turn match data into probabilities, and an analytics layer built in-house that detects value against bookmaker odds and tracks the accuracy of every prediction against real results. This page explains both layers — what they do, how we verify them, and what they can't do.
Layer 1: The prediction engine
Match probabilities are produced by machine-learning models trained on years of historical football data. For every fixture, the models weigh team form, head-to-head records, player availability and individual player contribution — a player's recent form, position and impact on overall team performance — and convert these signals into probability distributions for each betting market.
Probabilities are generated for 81 leagues across 8 markets: 1X2, Both Teams to Score, Over/Under 2.5 and 3.5 goals, Correct Score, Half-Time/Full-Time, First Half Result and Double Chance. They are recalculated daily as new data arrives, with no human intervention — every number on this site is a model output, not an opinion.
Layer 2: What we build on top
Everything in this layer is designed, built and run in-house by our team. It is what turns raw probabilities into something you can act on — and verify.
Value bet detection
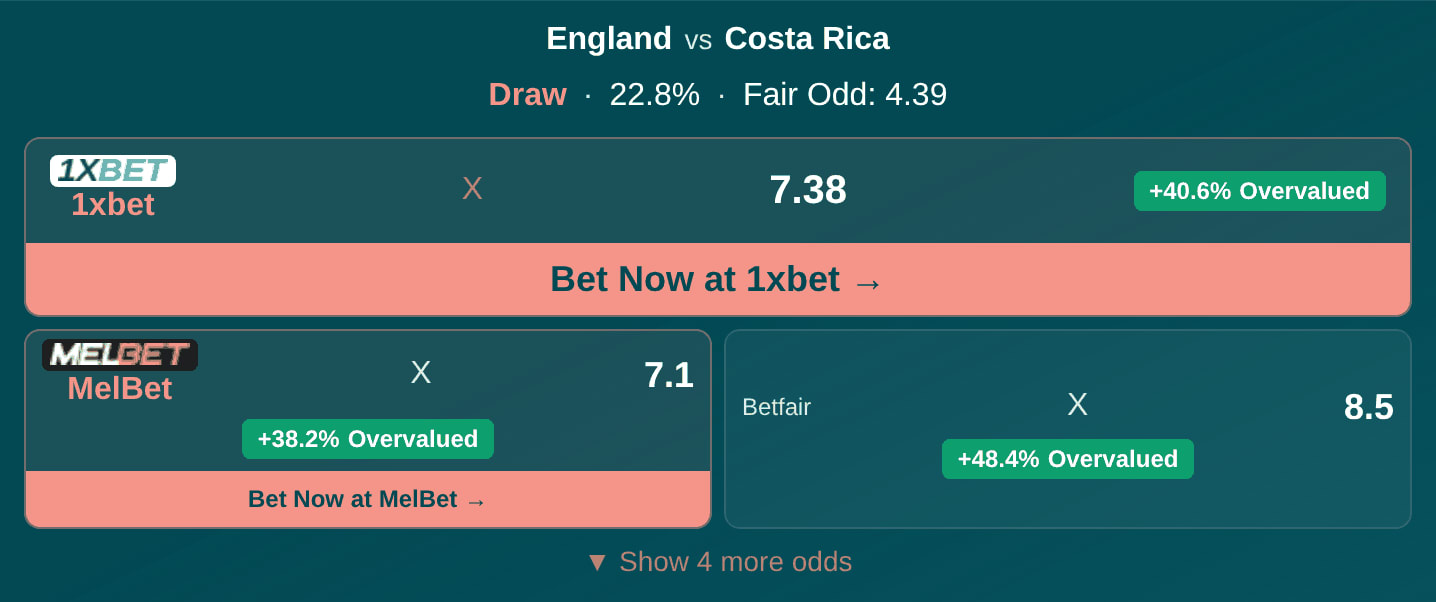
Daily picks selection
Picks of the Day, Bet of the Day and every market tips page are fed by one thing: the picks engine — the same rules, run every morning. Each market has its own published probability bar, and every pick needs a real bookmaker price that passes the fair odd check. The full rule set, thresholds included, is in the picks engine chapter below. When nothing clears the bar, we publish nothing.
Accuracy tracking

ROI tracking

From Predictions to Published Picks — Inside the Picks Engine
This is where the question "how do AI football predictions work" gets its concrete answer. Every morning one automated routine — our picks engine — goes through today's fixtures. No editor, no gut feeling. For each fixture it takes the model's probability for every outcome in every market it covers. An outcome becomes a candidate pick only when that probability clears the bar set for it. Every market has its own bar, and the bars are public — they're in the table below.
The Bars, Market by Market — Our Football Prediction Algorithm in Numbers
These are the live thresholds, taken straight from the engine's configuration. The model's probability for the exact outcome must meet the bar — otherwise no pick, no exceptions.
| Pick | Model probability bar | Why the bar sits there |
|---|---|---|
| Home win (1) | 61.5% | Raised above the standard bar after live results. |
| Away win (2) | 60% | Away wins pay better odds, so the bar sits a touch lower. |
| Draw (X) | 30% | Draws pay much bigger odds — 30% on a draw is a strong call. |
| BTTS (GG) | 57.5% | We only publish both teams to score — never "no goal". |
| Over 2.5 goals | 57.5% | The engine's standard bar. |
| Under 2.5 goals | 62.5% | Unders trade at shorter odds, so they need more certainty. |
| Over 3.5 goals | 37.5% | Deliberately low. Big odds carry a roughly 4-in-10 hit rate — our backtest says that's where this market has paid its way. |
| Under 3.5 goals | 70.5% | The strictest bar of all the goals markets. |
| 1st half (1) | 55.5% | First halves are short, so the bar sits below the full-match one. |
| 1st half (X) | 46.5% | Half-time draws are common and the odds still pay well. |
| 1st half (2) | 60% | Set high: below 60%, away leads at the break lost money at closing odds. |
| Double chance (1X) | 67.5% | Two outcomes covered means short odds — the bar is high. |
| Double chance (X2) | 67.5% | Same logic as 1X: cover costs certainty. |
| Double chance (12) | 77.5% | The "anyone but the draw" bet at the shortest odds — only near-locks clear it. |
| Home team over 1.5 goals | 60% | New market: in a past-year backtest, 2+ picks beat their predicted % in every band. |
| Away team over 1.5 goals | 60% | Same bar as the home side — fewer away teams get there. |
Thresholds come from a six-month calibration backtest and get re-checked against live results. When a bar moves, this table moves with it — the engine's live configuration is the single source.
Global Floors and Ceilings: a Real Price, a Fair Price — and a Sanity Check
Locked Odds, Public Settlement
Some Days We Publish Nothing
A thin fixture list, cagey matchups, bad prices — some days nothing clears the bars, and on those days the pages stay empty. The thresholds never move to fill a page. Friendly matches are excluded altogether — rotated squads make model probabilities unreliable, and we would rather skip a game than publish noise. One more honest note: correct score tips sit outside the engine. They are pure model probability — no odds market backs that bet type, so there is nothing to value-check, no locked odd and no ROI line. Every other tips page on the site runs on the rules above.
How the Tickets Are Composed
How we measure the match stats
Chances (xG)
Chances (xG): every shot gets a value for how likely it was to go in, and we add them up (our own model). Points their chances were worth: how many points teams usually get from chances like these.
How the match was played
Smash-and-grab: the winner created at least 0.8 xG less than the loser. Robbed: a draw where one side created at least 0.8 xG more. Anything else is a fair result. No verdict after extra time or when there's no xG.
Can you trust it? In these games, SportMonks' own xG agreed on who created more in 95% of the wins and 98% of the draws, and Flashscore agreed in 16 of the 20 games we checked by hand.
Luck check
For each of a team's last 10 games, we work out how many points a team usually gets from a game with those chances (xG) for and against, add them up and compare with the points it actually got. We do the same for goals. Strong teams often get a bit more than their chances suggest, so we compare each team with sides of similar strength in this league. That way nobody is flagged just for being good.
We flag a team when the gap is 4 points or more (or 3 goals or more). If some games have no xG data, we use the ones that do.
Does it mean anything? 85% of teams 4+ points ahead of their chances got fewer points in their next 10 games, and 83% of teams 4+ points behind got more. Bookmakers already expect these gaps to even out, so it's a fan's read, not a betting edge.
Strength rank
Strength rank: we rank this season's teams by how much better their attack is than their defence, using chances (xG), the odds and goals. Does it work? Over the first half of a season, this rank predicted the second half better than the league table did.
Score prediction
We look at how many chances each team has created and allowed in its recent games in this league, what the bookmakers expected from those games, and the goals actually scored. Then we compare that with how many goals home and away teams usually score here.
Does it work? Since July 2025, our numbers have been 7% closer to the real goals than just using the league average.
Goal-fest alert: we expect at least 2.7 goals, clearly more than usual in this league (8.5% above the average). Since July 2025, these games averaged 3.2 goals, and 62% went over 2.5.
Bore draw alert: we expect 2.3 goals or fewer, clearly less than usual (11% below the average). These games averaged 2.2 goals, and 63% stayed under 2.5.
Bookmakers usually see these coming too, so use the alert to know what kind of game to expect, not as a betting edge.
Facts and team numbers
We compare each team's last 10 games in this competition with how often the same thing happens across the whole league (last 12 months). A fact only shows when the team is noticeably different from a typical team. For example, if teams here score first in half their games, a team needs 7 or more out of 10 (or 3 or fewer). We show up to three facts, the most unusual first, never two about the same thing. They describe what happened, not a forecast.
For each team we take its last 10 games in this competition from the past 12 months (fewer if it hasn't played 10) and count how many went over 2.5 goals and how many had both teams scoring. The league figure uses all games played here in the last 12 months.
We use each team's last 10 games here. Corners and cards only count games where those stats were recorded, and goal times only count games with reliable goal minutes, so some teams have fewer than 10. We compare with the whole league over the last 12 months.
League stats: how we compare leagues
The league stats page compares every competition we cover on the same numbers: goals a match, Over 2.5, both teams scoring, home wins, draws, away wins, corners and cards. Each number uses the competition's matches from the last 12 months, without qualifying rounds, and is recalculated every night.
A competition is ranked when it has 50 or more matches in that window, the same rule as the profile on each league page; rank 1 is the highest value. Most domestic cups and the national-team competitions have no rank: they are listed under the ranking with their goals a match.
The top-and-bottom cards only use competitions with 100 or more matches, so a small sample can't top a list by luck.
The all-leagues average pools the ranked competitions: a share is all their matches with that outcome divided by all their matches, and a per-match number is each competition's value weighted by its matches.
How we verify accuracy
Predictions are recorded before kickoff and never edited afterwards. Losing predictions are displayed alongside winning ones, and negative-ROI markets stay on the tracker. If a number on this site cannot be traced back to settled match results, we don't publish it.
What our predictions can't do
No model predicts football reliably enough to guarantee profit. A 60% probability still loses four times out of ten — variance is part of the game, and losing runs are normal even when the underlying probabilities are well calibrated.
Frequently Asked Questions
How often are predictions updated?
Match probabilities are recalculated daily; bookmaker odds and value flags refresh every few minutes. Most data widgets display an "Updated X ago" stamp so you can see exactly how fresh the numbers are.
Why do you show losing predictions?
Because a track record you can't falsify is marketing, not evidence. Keeping every settled prediction — hits and misses — is what makes our published accuracy meaningful.
Which markets and leagues are covered?
Eight betting markets — 1X2, BTTS, Over/Under 2.5 and 3.5 goals, Correct Score, HT/FT, First Half Result and Double Chance — across 81 leagues worldwide.